
WOOMB International Congress
28th - 29th April 2023
Catholic University of the Sacred Heart, Rome
TO PARTICIPANTS IN THE WOOMB INTERNATIONAL CONGRESS ON “THE ‘BILLINGS REVOLUTION’ 70 YEARS LATER:
FROM FERTILITY KNOWLEDGE TO PERSONALIZED MEDICINE”
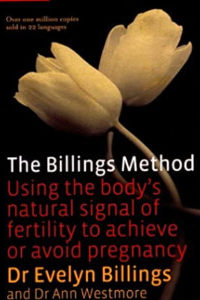
Founded by Drs John and Evelyn Billings, we aim to promote the authentic Billings Ovulation Method® in support of couples, the family and society.
Ensures authenticity of Billings Ovulation Method® resources and provides curricula for the training of Billings Ovulation Method® teachers.
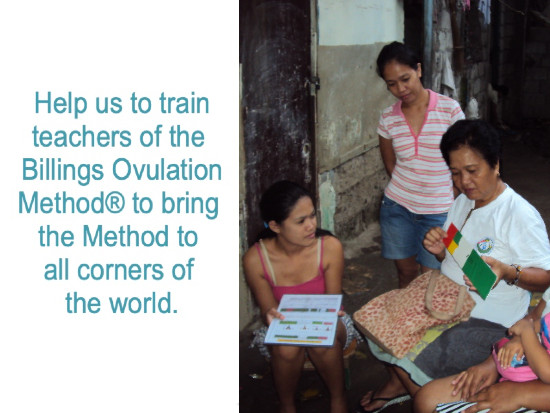
Offers Affiliations to organisations as the official Centre for the Training and Accreditation of Billings Ovulation Method® Teachers for that country.
Our Vision
“Knowledge of her body that every woman ought to have” Dr Evelyn Billings.
Understand
Help women to understand their fertility and reproductive health
Empower
Empower couples to have, or wait to have, a child
Strong Relationships
Build stronger relationships between couples and with their children
What We Offer


The Official Billings Ovulation Method® website
The Official Billings Ovulation Method® website
Read MoreI look forward to reading and completing this session. I love how beautifully organised and coordinated this training is.
Felicity - Australia
I am really enjoying Billings Training but it's sooooo very different from what I've learned in my previous training. We never talked about quality of the corpus luteum so I'm glad to learn about this.
Remote Training Course Trainee - Middle East
“What I love about the Billings Ovulation Method® is the clear understanding the woman gets about her body and reproductive system. It feels like a sense of ownership we’ve never learned.”
Remote Training Course Trainee – Europe
“The Billings Ovulation Method® training was really amazing, I am very happy and blessed to be able to attend”.
Basic and Upskilling Course - Canada
“The Billings Method™ has given me an awareness and understanding of my body for which I am endlessly grateful. I now trust my body and feel confident and in control."
Amy 28
“Thank you so much for leading and guiding me in my training up to this point. I appreciate you so much.“
Remote Training Course Trainee - Nigeria
“You all make my online training so amazing. Thank you so much and God bless you all.“
Remote Training Course Trainee – Nigeria
“It was my pleasure to obtain another opportunity to work with you and increase my knowledge in teaching the Billings Ovulation Method®.“
Emma - Tanzania
“Enjoyed it very much. Learned a lot. I am very grateful!“